Introduction
A ROAS calculator helps you measure how much revenue your advertising generates for every dollar spent. Instead of relying on surface metrics like clicks or impressions, it shows you whether your campaigns are financially efficient.
This ROAS calculator allows you to instantly calculate your Return on Ad Spend and compare it against your break-even threshold. With the right interpretation, your ROAS number becomes a decision tool for scaling, optimizing, or pausing campaigns.
In this guide, you will learn how to use the calculator correctly, understand what your result means, and apply profit-based logic to improve advertising performance.
Key Takeaways
- A ROAS calculator shows how much revenue you generate for every dollar spent on ads.
- Your ROAS result only becomes meaningful when compared to your break-even threshold.
- Break-even ROAS depends entirely on your profit margin.
- High ROAS does not guarantee profitability without margin context.
- Small improvements in targeting, conversion rate, and order value can significantly increase ROAS.
- Consistent reporting windows and attribution models are critical for accurate measurement.
Disclaimer: I am an independent Affiliate. The opinions expressed here are my own and are not official statements. If you follow a link and make a purchase, I may earn a commission.
Use the ROAS Calculator
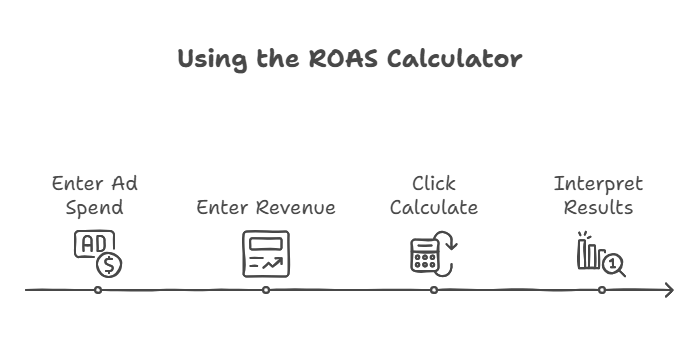
Use this simple ROAS Calculator to instantly measure the effectiveness of your ad campaigns.
Enter your total ad spend and the revenue generated from those ads for the same time period. The calculator will automatically compute your ROAS ratio.
ROAS Formula
ROAS = Revenue ÷ Ad Spend
If you spend $2,000 on ads and generate $8,000 in revenue, your ROAS is 4.0. That means you earn four dollars for every dollar spent.
The calculation is simple. The interpretation is what determines profitability.
How to Use the ROAS Calculator Correctly
Using the ROAS calculator is straightforward, but accuracy depends on consistency.
- Enter total ad spend.
Include all advertising costs for the selected time period. Use the same reporting window across platforms. - Enter revenue attributed to those ads.
Use the same attribution model consistently, whether that is platform reporting or analytics data. - Ensure the time period matches.
Do not compare last week’s spend with this month’s revenue. Misaligned time frames distort ROAS. - Calculate and compare against break-even.
Your ROAS number only becomes meaningful when evaluated against your required profitability threshold.
The formula is simple. Clean data makes it reliable.
What Your ROAS Result Means
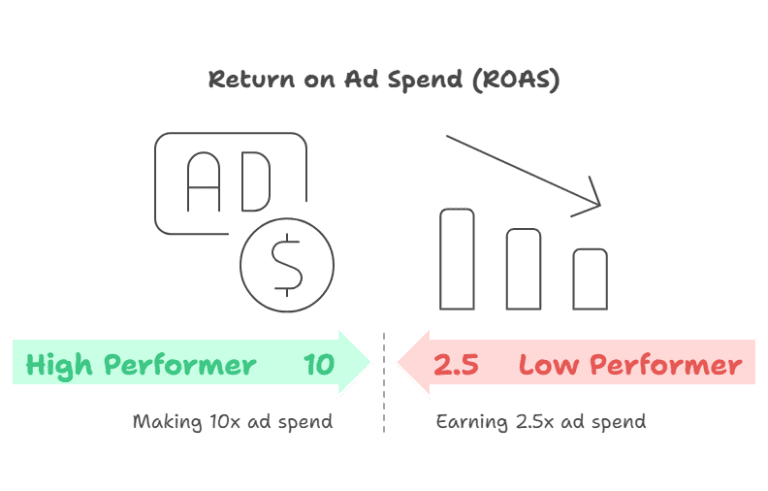
Your ROAS number tells you how efficiently your advertising spend generates revenue. On its own, it is a ratio. In context, it becomes a profitability signal.
Here is how to interpret your result.
ROAS = 1.0 (1:1)
You are generating one dollar in revenue for every dollar spent on ads.
This means you are breaking even on revenue, not profit. After product costs, fees, and overhead, you are likely operating at a loss.
ROAS Between 2:1 and 3:1
You are generating two to three dollars for every dollar spent.
Whether this is profitable depends entirely on your margin.
If your profit margin is high, this may be sustainable.
If your margin is low, this may still fall below break-even.
This range requires margin awareness.
ROAS Around 4:1
A 4:1 ROAS is often considered strong in ecommerce.
However, this number only works if your break-even ROAS is below 4.0. If your margin requires a 5:1 return to break even, a 4:1 result still loses money.
The ratio alone is not the decision. The margin defines the decision.
ROAS 5:1 and Higher
At this level, campaigns often generate meaningful contribution margin.
If performance remains stable at scale, this is typically where advertisers increase budget. However, rapid scaling can lower return if targeting expands too quickly.
Strong ROAS plus stable conversion rate supports growth.
ROAS Below Break-Even
If your ROAS is below your break-even threshold, your campaigns are not financially sustainable.
You can respond by:
- Improving conversion rate
- Increasing average order value
- Reducing cost per click
- Refining targeting
Without adjustment, scaling a below-break-even campaign increases losses.
Your ROAS result is not good or bad in isolation. It is profitable or unprofitable relative to your margin.
Break-Even ROAS Formula and Profit Framework
Your ROAS number only becomes meaningful when compared to your break-even threshold.
Break-even ROAS tells you the minimum return required to avoid losing money on advertising.
Break-Even ROAS Formula
Break-Even ROAS = 1 ÷ Profit Margin
Your profit margin must be expressed as a decimal.
Examples:
- 50% margin → 1 ÷ 0.50 = 2.0
- 30% margin → 1 ÷ 0.30 = 3.33
- 25% margin → 1 ÷ 0.25 = 4.0
- 20% margin → 1 ÷ 0.20 = 5.0
This means:
If your margin is 25 percent, your campaigns must generate at least a 4:1 ROAS just to break even on ad spend.
Anything below that loses money. Anything above that contributes to profit.
Why Margin Changes Everything
Two businesses can report the same ROAS and have completely different financial outcomes.
Example:
Company A
- ROAS: 4.0
- Margin: 50%
- Break-even: 2.0
- Result: Strong profitability
Company B
- ROAS: 4.0
- Margin: 25%
- Break-even: 4.0
- Result: Just breaking even
Same ROAS. Different financial reality.
The Profit Framework
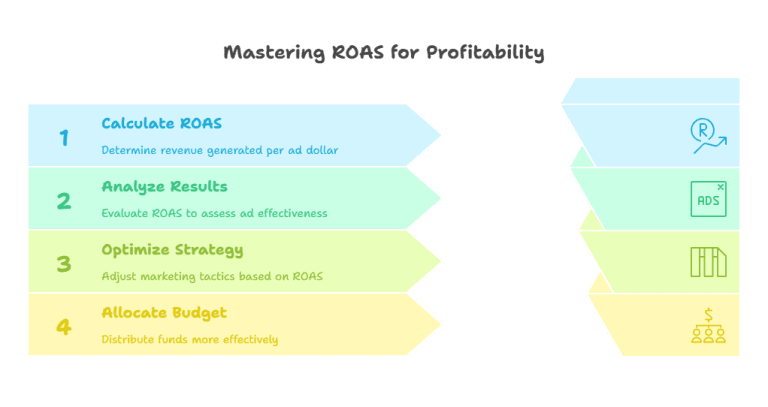
When evaluating ROAS, follow this sequence:
- Calculate ROAS.
- Calculate break-even ROAS.
- Compare the two numbers.
- Decide whether to scale, optimize, or pause.
This framework turns ROAS from a vanity metric into a profit control system.
ROAS vs ROI vs CAC
Return on Ad Spend is powerful, but it is not the only performance metric that matters. To make informed decisions, you need to understand how ROAS compares to ROI and Customer Acquisition Cost.
Here is how they differ.
| Metric | What It Measures | Includes All Business Costs? | Primary Use |
|---|---|---|---|
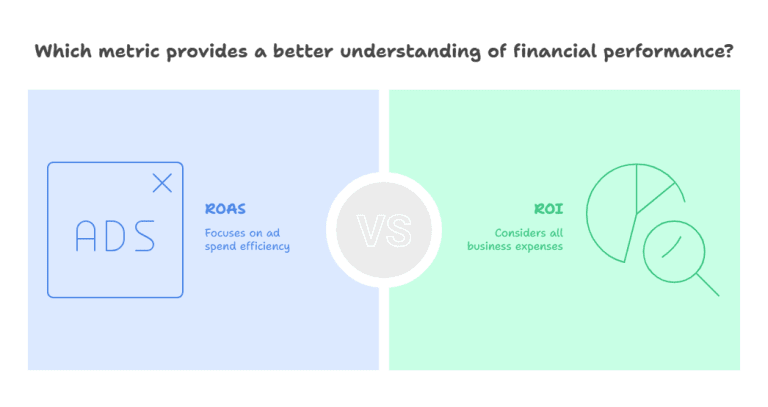
| ROAS | Revenue generated per dollar spent on ads | No | Measures advertising efficiency |
| ROI | Net profit relative to total investment | Yes | Measures overall business profitability |
| CAC | Cost to acquire one customer | No | Measures acquisition efficiency |
When to Use ROAS
Use ROAS when evaluating campaign performance inside ad platforms. It helps you determine whether your advertising spend is generating enough revenue to justify scaling.
ROAS focuses strictly on ad spend versus revenue.
When to Use ROI
Use ROI when evaluating the full financial health of a product or business initiative.
ROI includes:
- Product costs
- Operational expenses
- Overhead
- Marketing spend
A campaign can have strong ROAS but weak ROI if overall costs are too high.
When to Use CAC
Customer Acquisition Cost tells you how much it costs to acquire one customer.
CAC becomes powerful when paired with:
- Average Order Value
- Customer Lifetime Value
- ROAS
Together, these metrics give you a complete view of acquisition sustainability.
ROAS answers: “Are my ads generating revenue efficiently?”
ROI answers: “Is this investment profitable overall?”
CAC answers: “How much does it cost to acquire a customer?”
Each metric serves a different role. Strong advertisers understand how they work together.
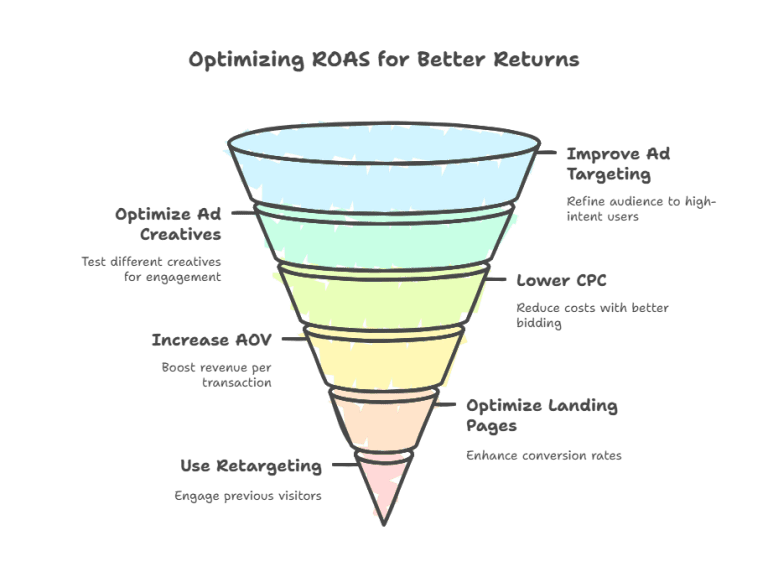
How to Improve Your ROAS
If your ROAS is below your target or break-even threshold, focus on the variables that directly influence the formula. ROAS only changes when revenue increases or ad cost decreases. The levers below control those outcomes.
Improve Targeting Quality
Low-intent traffic reduces conversion rate and wastes budget.
Refine your campaigns by:
- Excluding non-converting audiences
- Building lookalike audiences from buyers
- Prioritizing retargeting segments
- Segmenting by purchase intent
Higher-intent traffic improves revenue per dollar spent.
Increase Conversion Rate
Even small improvements in conversion rate can significantly increase ROAS without increasing ad spend.
Focus on:
- Clear value proposition above the fold
- Strong product benefits
- Social proof and testimonials
- Fast load speed
- Frictionless checkout
More conversions from the same traffic raise revenue efficiency.
Raise Average Order Value
ROAS improves when revenue per transaction increases.
You can increase Average Order Value by:
- Offering bundles
- Adding upsells
- Providing volume discounts
- Introducing subscription options
Higher order value improves ROAS even if traffic cost remains unchanged.
Reduce Cost Per Click
Lower traffic cost increases ROAS immediately.
You can reduce cost by:
- Improving ad relevance
- Testing new creatives
- Refining keyword selection
- Adjusting bidding strategy
Better ad quality often lowers cost while improving engagement.
Reallocate Budget Based on Performance
Capital allocation drives overall return.
Shift budget toward campaigns that exceed break-even ROAS. Reduce or pause campaigns operating below threshold. Review performance consistently to maintain efficiency.
Improving ROAS is not about guessing. It is about adjusting the variables that control revenue and cost.

Conclusion
A ROAS calculator gives you a clear, immediate view of how efficiently your advertising spend generates revenue. But the number alone is not the decision. Profit margin determines whether that return supports sustainable growth.
When you calculate ROAS consistently, compare it against your break-even threshold, and adjust campaigns based on financial logic rather than surface metrics, you turn advertising into a controlled investment instead of a guessing game.
Use this calculator regularly. Track performance by campaign, maintain consistent reporting windows, and evaluate results against margin requirements before scaling. When ROAS exceeds break-even with stable conversion performance, you have room to grow. When it falls below threshold, optimize before increasing spend.
Advertising performance improves when measurement improves. Start with the calculation. Make decisions based on profit. Repeat consistently.
For more marketing terms go to our Marketing Glossary Page.

Frequently Asked Questions About the ROAS Calculator
Why does my ROAS look different in Google Ads versus my calculator?
Ad platforms use their own attribution models and reporting windows. Your ROAS calculator uses the numbers you input, so differences usually come from attribution settings, time range mismatches, or delayed conversion tracking. Always compare the same time period and attribution method.
Should I use gross revenue or net revenue in the calculator?
For ROAS calculation, use revenue attributed directly to ads before subtracting business expenses. To evaluate profitability, compare the result to your break-even ROAS based on profit margin. Do not mix net profit into the ROAS formula itself.
Can I calculate ROAS for a single campaign instead of my whole account?
Yes. In fact, campaign-level ROAS is often more actionable. Enter ad spend and revenue for a specific campaign, ad group, or time period to identify which segments deserve more budget.
How often should I calculate ROAS?
You should calculate ROAS consistently within a defined reporting cycle. Many advertisers review weekly for optimization decisions and monthly for scaling decisions. Avoid daily reactions unless you have high volume and stable data.
What happens if my revenue is delayed?
If your business has delayed conversions, such as long sales cycles or subscription trials, short reporting windows can underestimate ROAS. In that case, evaluate ROAS over a longer period or incorporate projected lifetime value when interpreting results.
Can this calculator help with scaling decisions?
Yes, but only after you compare ROAS to your break-even threshold. Scaling is safer when ROAS exceeds break-even with stable conversion rates. Expanding budget without margin protection can reduce overall profitability.

1 Comment
Return on Ad Spend: How to Improve it ROAS - Ismel Guerrero. · March 9, 2025 at 2:39 pm
[…] to measure your ROAS instantly? Use our ROAS Calculator to track your ad performance and make data-driven decisions […]