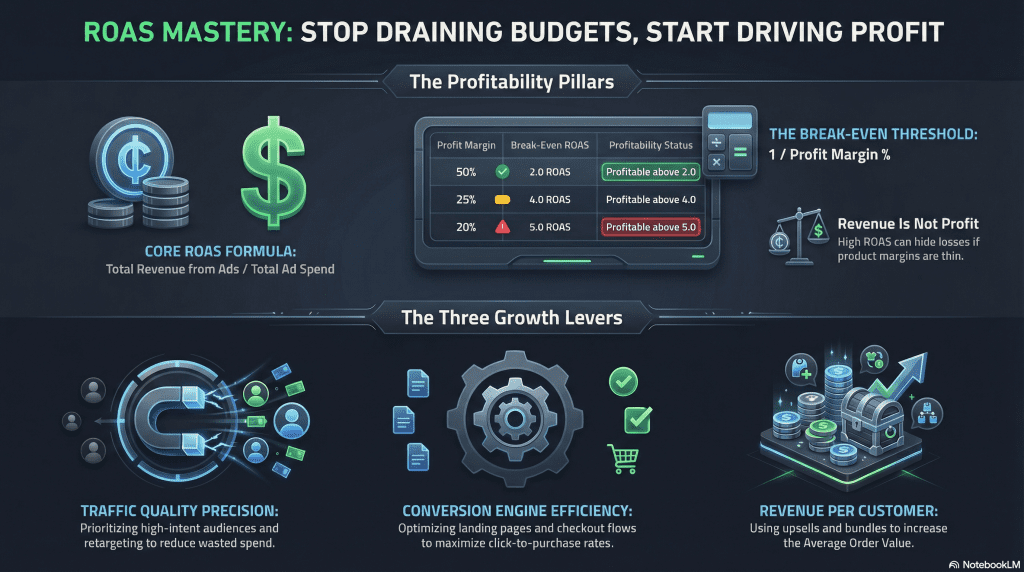
Return on Ad Spend, or ROAS, measures how much attributed revenue or conversion value your advertising generates relative to what you spend.
It is one of the clearest ways to connect paid advertising with business value. Clicks, impressions, and engagement can tell you how people interact with an ad. ROAS goes further by asking whether that advertising produces enough value to justify its cost.
But ROAS is not a profitability metric by itself.
A campaign can report a high ROAS and still have weak economics if margins are thin. Two businesses can also generate the same ROAS while requiring completely different returns to break even.
That is why ROAS becomes most useful when you understand what is behind the number.
This guide explains how ROAS is calculated, what a good ROAS actually means, how attribution affects the result, what drives performance, and how to improve ROAS without confusing advertising efficiency with total business profitability.
- ROAS measures attributed conversion value relative to advertising spend. It evaluates advertising efficiency, not total business profit.
- There is no universal good ROAS. The return you need depends on your margins, business model, customer economics, and campaign objective.
- Break-even ROAS should be based on the contribution margin available before advertising. Lower-margin businesses require more revenue per advertising dollar to cover their costs.
- ROAS is shaped by traffic cost, conversion efficiency, and conversion value. Improving any one of these can change the result, but the variables often affect each other.
- Attribution affects reported ROAS. Different platforms, attribution models, conversion windows, and value adjustments can assign different amounts of revenue to the same advertising activity.
- A higher ROAS is not always the best business outcome. Maximizing efficiency can sometimes limit profitable growth, new customer acquisition, or total contribution.
- Improving ROAS starts with accurate measurement. Once the data is reliable, identify whether the main constraint is acquisition cost, conversion rate, conversion value, or another part of the customer journey.
Disclaimer: I am an independent Affiliate. The opinions expressed here are my own and are not official statements. If you follow a link and make a purchase, I may earn a commission.

What Is Return on Ad Spend?
Return on Ad Spend measures the value generated by advertising relative to the amount spent on that advertising.
The standard formula is:
ROAS = Attributed Revenue or Conversion Value ÷ Ad Spend
Suppose a campaign costs $2,000 and generates $8,000 in attributed revenue.
$8,000 ÷ $2,000 = 4.0
The campaign has a 4.0x ROAS.
That means it generated $4 in attributed revenue for every $1 spent on advertising.
Google Ads similarly reports ROAS through conversion value relative to advertising cost.
How ROAS Is Expressed
The same result can appear in several formats:
- 4.0x
- 4:1
- 400%
They all communicate the same relationship.
A 4.0x ROAS means every $1 of advertising spend generated $4 in attributed value.
Revenue ROAS vs. Conversion Value
ROAS is commonly discussed as:
Revenue ÷ Ad Spend
That works well when the conversion value being measured is actual sales revenue.
However, advertising platforms can also assign values to other conversions.
For example, a business might value:
- A qualified lead at $100.
- A booked consultation at $250.
- A subscription at its expected initial value.
- Different product purchases according to actual transaction revenue.
Google Ads allows advertisers to assign different conversion values and optimize toward those values, including revenue or other representations of business value.
This means you should always know what the numerator in your ROAS calculation represents.
A reported 5x ROAS based on actual sales revenue is not necessarily equivalent to a 5x result based on internally assigned lead values.
For a quick calculation using your own advertising spend and attributed revenue, use our ROAS Calculator.

Why ROAS Matters
ROAS gives advertisers a way to move beyond activity metrics and evaluate the value associated with advertising spend.
It Connects Advertising Cost With Value
Clicks tell you that someone interacted with an advertisement.
Impressions tell you that an advertisement had an opportunity to be seen.
Click-through rate tells you how frequently impressions produced clicks.
None of those metrics tells you how much value the campaign generated relative to its cost.
ROAS adds that financial layer.
A campaign can have an impressive click-through rate and inexpensive traffic while producing very little revenue.
Another campaign can have expensive clicks but generate enough conversion value to justify the cost.
ROAS helps distinguish between the two.
It Helps Compare Advertising Performance
When measured consistently, ROAS can help compare:
- Campaigns.
- Advertising channels.
- Products.
- Audiences.
- Geographic markets.
- Offers.
- Reporting periods.
For example, two campaigns might each spend $5,000.
If one generates $10,000 in attributed revenue and another generates $25,000, their revenue efficiency is clearly different.
ROAS makes that difference easy to see.
What ROAS Cannot Tell You
ROAS is useful precisely because it focuses narrowly on advertising.
That also creates its limitations.
ROAS alone does not tell you:
- Whether the entire business is profitable.
- How much cash the business generated.
- The full cost of acquiring a customer.
- Whether customers will purchase again.
- How fixed overhead affects profitability.
- Whether the reported revenue would have occurred without the advertising.
- Whether the attribution system assigned credit correctly.
A business can therefore have strong ROAS and weak overall economics.
The metric should inform financial decisions, not replace them.
How ROAS Works
ROAS reflects the economics of the path between advertising spend and conversion value.
At a high level:
Ad Spend → Traffic → Conversions → Conversion Value → ROAS
Each stage affects the result.
Expensive traffic can reduce efficiency.
Weak conversion performance can reduce the amount of value produced from that traffic.
Higher-value purchases can improve ROAS even when traffic costs remain unchanged.
ROAS in a Simplified CPC Ecommerce Model
For a simple ecommerce campaign where advertising is purchased by the click, we can break ROAS into three variables:
ROAS = (Conversion Rate × Average Order Value) ÷ Cost Per Click
This is not the universal ROAS formula. It is a simplified model that helps show how common campaign variables interact.
Suppose:
- Cost per click = $2
- Conversion rate = 2%
- Average order value = $100
For every 100 clicks:
- Ad spend = $200
- Orders = 2
- Revenue = $200
ROAS is:
$200 ÷ $200 = 1.0x
The same result appears through the simplified equation:
(0.02 × $100) ÷ $2 = 1.0x
Now suppose the conversion rate improves from 2% to 3%, while CPC and average order value remain unchanged.
(0.03 × $100) ÷ $2 = 1.5x
If average order value then increases from $100 to $120:
(0.03 × $120) ÷ $2 = 1.8x
Nothing about the ad cost changed.
The campaign improved because more visitors converted and each conversion produced more revenue.
Why the Variables Interact
Real campaigns are not controlled experiments.
Reducing CPC can sometimes bring less qualified traffic.
Expanding an audience can increase sales volume while lowering average ROAS.
A more aggressive discount can improve conversion rate while reducing the contribution earned on each purchase.
This is why individual metrics should not be optimized in isolation.
The goal is to improve the economics of the entire system.

What Is a Good ROAS?
There is no universal good ROAS.
A 2x result can be economically attractive for one business and unsustainable for another.
A 5x result can be excellent, merely acceptable, or unnecessarily restrictive depending on margins and growth objectives.
The right benchmark starts with the economics of the business.
Break-Even ROAS
Break-even ROAS estimates the minimum return required for the contribution available before advertising to cover the advertising spend being evaluated.
A useful simplified formula is:
Break-Even ROAS = 1 ÷ Contribution Margin Before Ad Spend
Contribution margin is the revenue remaining after relevant variable costs. Shopify similarly defines contribution margin as sales revenue remaining after variable expenses.
Suppose your contribution margin before advertising is 40%.
Expressed as a decimal:
40% = 0.40
Break-even ROAS is:
1 ÷ 0.40 = 2.5x
That means every $1 of advertising spend needs to generate $2.50 in revenue for the available 40% contribution to cover the advertising cost.
Other examples:
- 50% margin → 2.0x
- 40% margin → 2.5x
- 30% margin → 3.33x
- 25% margin → 4.0x
- 20% margin → 5.0x
Which Margin Should You Use?
Avoid using an undefined “profit margin.”
For this break-even calculation, the useful figure is the portion of revenue remaining after relevant variable costs but before the advertising spend being analyzed.
Depending on the business, variable costs can include:
- Cost of goods sold.
- Fulfillment.
- Packaging.
- Payment processing fees.
- Shipping subsidies.
- Sales commissions.
- Expected refunds or returns.
- Other costs that change with each sale.
Fixed costs still exist, but they serve a different purpose in the financial model.
Break-even ROAS should therefore not be confused with the point where the entire company generates zero net profit.
Target ROAS
Break-even ROAS tells you the minimum return required under the assumptions used.
Target ROAS represents the return you actually want.
A business with a 2.5x break-even ROAS might decide it needs a 3.5x target to preserve enough contribution for overhead, profit, cash flow, or another objective.
In Google Ads, Target ROAS similarly represents the average conversion value an advertiser wants for each dollar spent. Google advises setting the target with business goals and historical performance in mind.
Why Universal ROAS Benchmarks Are Misleading
Consider two businesses producing the same 4.0x ROAS.
Business A has a 50% contribution margin before advertising.
Its break-even ROAS is:
1 ÷ 0.50 = 2.0x
Business B has a 25% contribution margin.
Its break-even ROAS is:
1 ÷ 0.25 = 4.0x
Business A is well above its advertising break-even threshold.
Business B is only at break-even under this simplified framework.
Same ROAS.
Different economic result.
That is why statements such as “4x is a good ROAS” need context.

What Factors Affect ROAS?
ROAS changes when advertising cost or the value attributed to advertising changes.
Several factors influence those outcomes.
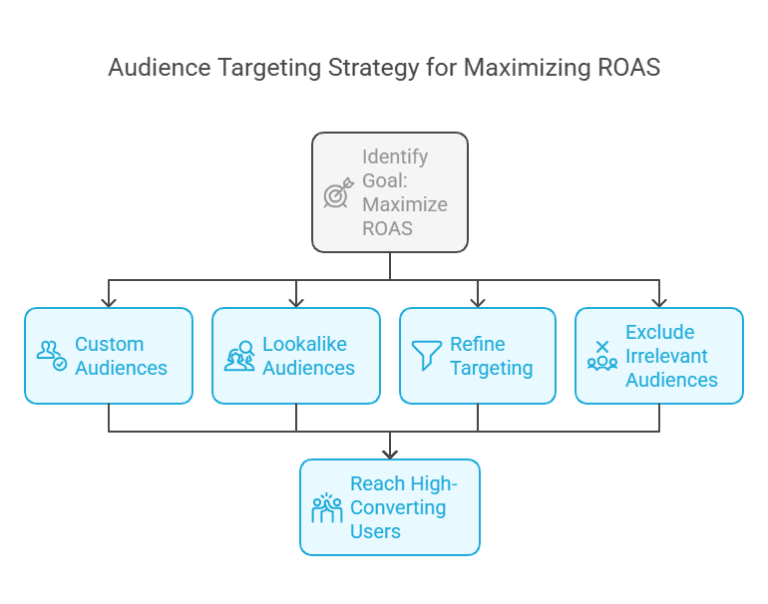
Traffic Cost and Audience Quality
The amount paid to reach an audience directly affects advertising efficiency.
Higher CPC, CPM, or other acquisition costs can put downward pressure on ROAS unless the traffic produces correspondingly more value.
Audience quality matters as well.
Traffic aligned with the offer and customer intent may convert more efficiently than poorly matched traffic.
However, higher-intent audiences can also be more competitive and expensive to reach.
The goal is not simply to acquire the cheapest traffic.
It is to acquire traffic at a cost that makes sense relative to the value it produces.
Ad Creative and Offer Relevance
Creative influences who pays attention to the advertisement and what expectation they develop before reaching the next step.
Strong creative should do more than increase clicks.
It should attract the right clicks.
An advertisement that generates curiosity but poorly represents the offer can increase CTR without improving ROAS.
Better alignment between the message, audience, offer, and destination gives the campaign a stronger chance of converting paid attention into value.
Conversion Rate
Conversion rate determines how much value you extract from the traffic you already purchased.
A campaign can acquire highly relevant visitors and still perform poorly if the website creates unnecessary friction.
Factors that can affect conversion include:
- Offer clarity.
- Page speed.
- Mobile usability.
- Pricing.
- Checkout experience.
- Form friction.
- Trust signals.
- Product-market fit.
Improving conversion rate can increase ROAS without requiring an equivalent increase in traffic.
Average Order or Conversion Value
ROAS can also improve when each conversion becomes more valuable.
For ecommerce, this may involve:
- Higher average order value.
- Bundles.
- Cross-sells.
- Upsells.
- Product mix.
- Repeat purchases.
For lead generation, different actions can also represent different values.
A qualified sales opportunity may deserve more weight than a generic form submission if the business has reliable evidence supporting those values.
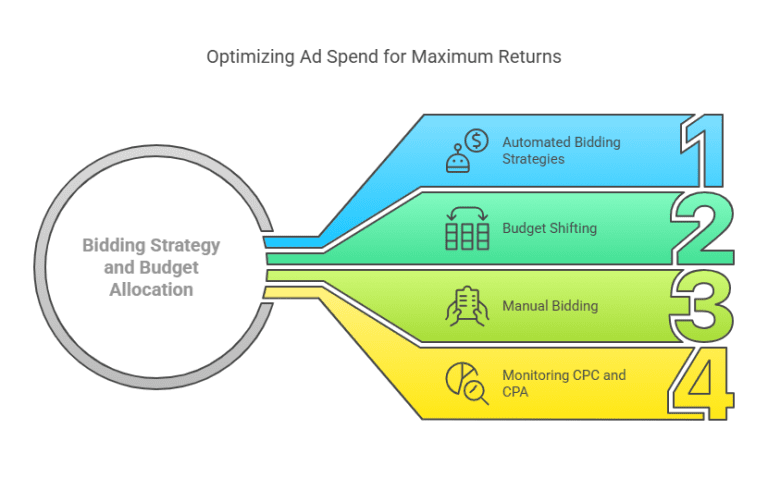
Bidding and Budget Allocation
Advertising spend should not be distributed equally simply because campaigns exist.
Some campaigns, products, audiences, or markets will produce stronger economics than others.
Bidding and budget allocation determine how aggressively the business competes for those opportunities.
Poor allocation can send too much money toward low-value traffic while constraining stronger opportunities.
The goal is to direct spend where incremental value justifies the cost.
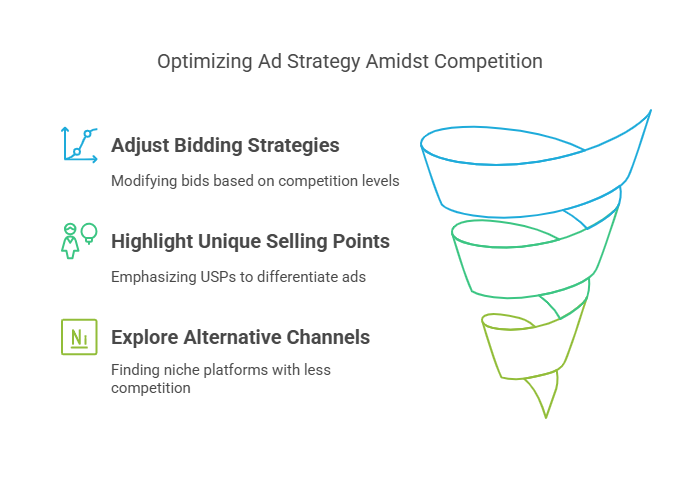
Competition and Seasonality
ROAS does not operate in a fixed environment.
Advertising costs and conversion behavior can change because of:
- Seasonal demand.
- Promotions.
- Competitor activity.
- Economic conditions.
- Inventory.
- Product launches.
- Changes in consumer behavior.
A campaign can become less efficient without anything technically breaking.
Performance needs to be interpreted within the market conditions in which it occurred.
How Attribution Affects ROAS
ROAS depends on attributed value.
That means the attribution system can materially affect the number you see.
Attribution Models
Customers do not always click one ad and immediately purchase.
They may interact with several ads or marketing channels before converting.
An attribution model determines how credit is assigned across those interactions.
Google Ads currently supports data-driven and last-click attribution for applicable conversion actions. Google explains that the selected model affects how conversion credit is distributed and can also influence automated bidding that uses conversion data.
This means two attribution methods can produce different campaign-level ROAS even when total sales remain unchanged.
Conversion Windows
A conversion window determines how long after an advertising interaction a conversion can still receive credit.
A short window can exclude purchases that happen later.
A longer window can assign credit to advertising interactions further back in the customer journey.
Google Ads allows conversion windows to vary by conversion type and explicitly notes that the setting determines whether later conversions are recorded for an advertising interaction.
Businesses with longer buying cycles should be particularly careful when interpreting recent ROAS.
Platform vs. Analytics Reporting
Your advertising platform and analytics system may report different revenue or conversions.
That does not automatically mean one is broken.
Differences can arise from:
- Attribution models.
- Reporting delays.
- Conversion windows.
- Source classification.
- Cross-device measurement.
- Consent and privacy limitations.
- Time-zone settings.
- Different conversion definitions.
Google notes that comparisons between Google Ads and Analytics can still differ because of attribution models, lookback windows, and platform processing.
Consistency matters when comparing performance.
Returns, Refunds, and Cancellations
Initial revenue is not always realized revenue.
An ecommerce campaign may report a purchase that is later returned.
A subscription may be cancelled.
An order may be refunded.
If those changes are not reflected in the values used for ROAS, reported performance can overstate the economics that the business ultimately receives.
For businesses with meaningful return or cancellation rates, value adjustment should be part of the measurement strategy.
Cross-Channel Journeys
Customers can interact with multiple channels before purchasing.
A journey might include:
Social ad → organic search → email → paid search → purchase
Which channel deserves the revenue?
There is no single answer that applies to every business.
The important point is to understand what your reporting system is crediting before treating ROAS as objective truth.
ROAS vs. ROI vs. CAC
ROAS, ROI, and CAC all deal with economics, but they answer different questions.
| Metric | What It Measures | Cost Scope | Main Use |
|---|---|---|---|
| ROAS | Attributed value relative to ad spend | Advertising costs | Advertising efficiency |
| ROI | Net return relative to investment | Broader relevant costs | Overall investment profitability |
| CAC | Cost required to acquire a new customer | Sales and marketing acquisition costs | Customer acquisition economics |
ROAS
ROAS isolates advertising.
It asks: How much attributed value did advertising generate relative to ad spend?
This makes it useful for campaign and channel analysis.
ROI
ROI asks a broader question: Was the investment profitable after the relevant costs were considered?
ROAS can therefore be strong while overall ROI remains weak. The advertising may generate substantial revenue while production, payroll, overhead, fulfillment, or other expenses consume most of the return.
CAC
Customer Acquisition Cost measures the cost of acquiring a new customer.
A full CAC calculation can include advertising as well as sales and marketing salaries, commissions, software, agencies, creative production, and other acquisition expenses.
HubSpot currently defines CAC as total sales and marketing expenses divided by new customers acquired during the same period.
CAC becomes more useful when compared with customer value. A high CAC may be sustainable when customers remain valuable for years. A low CAC may still be unattractive when customers produce little margin or churn quickly.
ROAS, ROI, and CAC should therefore complement each other rather than compete for the role of one universal performance metric.

How to Improve ROAS Step by Step
Improving ROAS should start with diagnosis.
Random changes make it difficult to understand what actually improved performance.
1. Verify Your Measurement
Do not optimize a number you do not trust.
Check:
- Conversion tracking.
- Revenue or conversion values.
- Attribution settings.
- Conversion windows.
- Reporting periods.
- Refunds or cancellations where relevant.
Make sure the value being attributed to advertising represents something economically meaningful.
2. Define Break-Even and Target ROAS
Know the difference between:
What the campaign must produce
and
what you want it to produce.
Break-even creates the economic floor.
Target ROAS creates the performance objective.
Without those reference points, a 3x or 5x result has little strategic meaning.
3. Diagnose Where ROAS Is Being Lost
Break the problem into its components.
Is the campaign paying too much for traffic?
Is the traffic poorly matched?
Is the landing page failing to convert?
Is conversion value too low?
Is attribution overstating or understating performance?
Do not assume every ROAS problem is an advertising problem.
Sometimes the biggest opportunity exists after the click.
4. Improve Traffic Efficiency
Look for advertising spend that is not producing sufficient value.
Depending on the platform, this can involve:
- Refining audience targeting.
- Improving keyword intent.
- Adding exclusions.
- Removing weak placements.
- Testing stronger creative.
- Adjusting geographic targeting.
- Reviewing bidding.
- Separating audiences with materially different economics.
The goal is not simply cheaper traffic.
It is better value relative to traffic cost.
5. Improve Conversion Efficiency
Once the traffic reaches the destination, the website needs to convert that attention.
Review:
- Message alignment.
- Value proposition.
- Product information.
- Trust.
- Forms.
- Checkout.
- Pricing.
- Page speed.
- Mobile experience.
If conversion rate rises while traffic cost and conversion value remain stable, ROAS improves.
6. Increase Conversion Value
Higher value per conversion can improve ROAS even without reducing acquisition costs.
Depending on the business, this may involve:
- Bundles.
- Upsells.
- Cross-sells.
- Better product mix.
- Higher-value lead prioritization.
- Subscription options.
- Repeat-purchase strategies.
Revenue growth should still be evaluated alongside margin.
A higher order value created by excessive discounting may look better in ROAS while contributing less profit than expected.
7. Reallocate Budget and Test Scaling
Move budget according to economic opportunity rather than habit.
Campaigns above target may deserve more investment.
Campaigns below target may need optimization, restructuring, or less spend.
But avoid assuming that the historical ROAS will remain unchanged as budget increases.
Scaling changes the opportunities the advertising system needs to pursue.
Evaluate what the additional spend actually produces.

Common ROAS Mistakes
The ROAS formula is simple. Interpretation is where many mistakes happen.
Treating Revenue as Profit
ROAS measures value relative to advertising cost.
It does not subtract every cost required to produce that value.
A high ROAS can still accompany weak profitability when margins or other expenses are unfavorable.
Using the Wrong Margin for Break-Even ROAS
Using a generic “profit margin” creates ambiguity.
Break-even advertising analysis should be based on a clearly defined contribution margin before the ad spend being evaluated.
Know which costs have already been removed from revenue before calculating the threshold.
Optimizing for Cheap Clicks
Lower CPC is attractive because the improvement is immediately visible.
But cheaper clicks do not help if they produce proportionally less value.
A campaign can reduce CPC while worsening ROAS.
Comparing Inconsistent Attribution
Do not compare two ROAS figures as if they mean the same thing when they use different:
- Conversion windows.
- Attribution models.
- Revenue definitions.
- Conversion values.
- Reporting periods.
Measurement consistency should come before performance comparison.
Reacting to Incomplete Data
Advertising cost is often visible before all resulting conversions have occurred or been reported.
Recent ROAS can therefore appear artificially weak.
Businesses with delayed conversions need reporting windows that allow enough time for performance to mature.
Scaling From Average ROAS Alone
Average ROAS tells you what existing spend produced.
It does not tell you exactly what additional spend will produce.
The next segment of traffic may be more expensive or less efficient than the opportunities already captured.
Optimizing for ROAS at the Expense of Volume
An extremely high ROAS is not automatically the optimal business outcome.
A campaign spending $1,000 at 10x ROAS may produce less total contribution than a campaign that could spend $50,000 profitably at 4x.
Efficiency and scale need to be considered together.
Why a Higher ROAS Is Not Always Better
ROAS is often treated as a metric that should simply move upward.
That can create the wrong objective.
Growth vs. Efficiency
Maximum ROAS and maximum profit are not necessarily the same point.
As advertising spend increases, a business may need to accept a lower average ROAS to access additional customers.
That can still be economically attractive if the additional sales generate enough contribution.
The objective is not to protect the highest possible ratio.
It is to find the level of spending that best supports the business objective.
Customer Lifetime Value
First-purchase ROAS does not always represent the full value of a customer.
A subscription business might accept weak initial economics because customers generate recurring revenue.
An ecommerce company with strong repeat purchase behavior may also tolerate a lower first-order ROAS than a business where customers purchase only once.
This does not mean future value should be assumed.
Lifetime value should be based on actual retention and purchasing data.
New vs. Existing Customers
Retargeting existing customers or high-intent visitors can produce strong ROAS because those audiences already know the business.
New customer acquisition is often harder.
If a company optimizes only for the highest immediate ROAS, it may direct too much budget toward people who were already likely to convert and underinvest in reaching new customers.
The strategic value of the conversion matters alongside the immediate return.
Marginal ROAS
Marginal ROAS focuses on what additional advertising spend produces.
Google defines marginal ROAS as the increase in conversion value divided by the increase in spend.
Suppose a campaign spends $10,000 and generates $50,000 in conversion value.
Average ROAS is:
5.0x
You then increase spend by $5,000 and generate an additional $15,000 in value.
Marginal ROAS on that added spend is:
$15,000 ÷ $5,000 = 3.0x
The campaign’s historical average ROAS may still look excellent.
But the additional dollars are producing a lower return.
That is the number that becomes especially relevant when deciding whether further scaling makes sense.

Real-World ROAS Example
Consider an ecommerce business spending $10,000 per month on advertising.
The campaign generates:
- Revenue: $40,000
- Ad spend: $10,000
Actual ROAS is:
$40,000 ÷ $10,000 = 4.0x
At first glance, the result looks strong.
Now add the underlying economics.
Business A: 30% Contribution Margin Before Ads
Suppose relevant variable costs before advertising equal $28,000.
Revenue:
$40,000
Variable costs:
$28,000
Contribution before advertising:
$12,000
Contribution margin:
$12,000 ÷ $40,000 = 30%
Break-even ROAS:
1 ÷ 0.30 = 3.33x
The actual 4.0x ROAS exceeds the 3.33x break-even threshold.
Now subtract advertising:
$12,000 − $10,000 = $2,000 contribution after advertising
The campaign leaves $2,000 after the defined variable costs and advertising.
That is not necessarily net profit.
Fixed overhead and other expenses may still need to be covered.
Business B: 50% Contribution Margin Before Ads
Now suppose another business has the same revenue and advertising spend but only $20,000 in relevant variable costs.
Contribution before advertising:
$20,000
Contribution margin:
50%
Break-even ROAS:
1 ÷ 0.50 = 2.0x
After advertising:
$20,000 − $10,000 = $10,000 contribution after advertising
Both campaigns generated a 4.0x ROAS.
One left $2,000 after variable costs and advertising.
The other left $10,000.
ROAS alone could not reveal that difference.
What Should the Business Evaluate Before Scaling?
Before increasing spend, consider:
- How far actual ROAS sits above break-even.
- Whether conversion performance is stable.
- What additional spend is likely to produce.
- Available cash flow.
- Inventory or service capacity.
- Customer lifetime value where relevant.
- Whether the business is meeting its broader profit objectives.
ROAS tells you where to begin the analysis.
It should not be where the analysis ends.
When ROAS Is Most Useful
ROAS works best when advertising cost and conversion value can both be measured with reasonable confidence.
It is particularly useful for:
- Ecommerce campaigns with transaction revenue.
- Paid campaigns with clearly assigned conversion values.
- Comparing advertising campaigns or products.
- Evaluating paid acquisition channels.
- Businesses with relatively short and measurable conversion journeys.
In these situations, advertising spend and generated value can be connected directly enough for the metric to support useful decisions.
When ROAS Is Less Complete
ROAS becomes less informative when the advertising effect is difficult to connect with immediate conversion value.
Examples include:
- Long B2B sales cycles.
- Offline sales with weak attribution.
- Brand-awareness campaigns.
- Businesses where most customer value occurs long after acquisition.
- Campaigns with poorly defined conversion values.
- Complex customer journeys involving many channels.
ROAS can still contribute to analysis in these situations.
It simply should not carry more decision weight than the available measurement supports.
Conclusion
Return on Ad Spend is one of the most useful metrics for understanding advertising efficiency because it connects advertising cost directly with attributed value.
But ROAS is not a complete profitability verdict.
A useful analysis starts by calculating the metric correctly and understanding what value has been attributed to the advertising. It then compares that result with the contribution economics of the business, considers how attribution affects reporting, and identifies the variables driving performance.
There is no universal ROAS that every business should pursue.
The right return depends on what the business sells, what it costs to fulfill the sale, how customers are acquired, how much they are worth, and what the advertising is expected to accomplish.
Use ROAS to understand efficiency.
Use break-even ROAS to establish the economic floor.
Then improve the part of the acquisition system that is limiting value.
When you need to calculate your result quickly, use the ROAS Calculator and bring the number back into this broader financial context before making the decision.

Frequently Asked Questions
What Does ROAS Stand For?
ROAS stands for Return on Ad Spend. It measures the attributed revenue or conversion value generated relative to advertising spend.
How Is ROAS Calculated?
Use:
ROAS = Attributed Revenue or Conversion Value ÷ Ad Spend
If a campaign generates $20,000 in attributed revenue from $5,000 in advertising spend, ROAS is 4.0x.
What Is a Good ROAS?
There is no universal good ROAS.
The appropriate result depends on your contribution margin, business costs, customer economics, and campaign goals.
Compare actual ROAS with your break-even and target returns rather than relying on a generic benchmark.
What Is Break-Even ROAS?
Break-even ROAS estimates the minimum advertising return required for the contribution available before advertising to cover ad spend.
A simplified formula is:
Break-Even ROAS = 1 ÷ Contribution Margin Before Ad Spend
For example, a 25% contribution margin produces a 4.0x break-even ROAS.
Can ROAS Be Negative?
Standard ROAS cannot be negative when both conversion value and advertising spend are nonnegative because the metric divides value by cost.
A campaign can still lose money even though its ROAS is positive.
For example, a 2.0x ROAS may be below break-even for a low-margin business.
Is a Higher ROAS Always Better?
No.
A higher ROAS indicates greater attributed value relative to ad spend, but maximizing the ratio can sometimes restrict profitable volume or new customer acquisition.
The better objective is the return and spending level that best supports the economics and goals of the business.
What Is the Difference Between ROAS and ROI?
ROAS evaluates attributed value relative to advertising spend.
ROI evaluates net return relative to a broader investment.
ROAS is primarily an advertising efficiency metric, while ROI is used for broader profitability analysis.
What Is the Difference Between ROAS and CAC?
ROAS measures value generated relative to ad spend.
CAC measures how much it costs to acquire a new customer and can include broader sales and marketing expenses beyond advertising.
The two metrics can be used together to understand advertising efficiency and customer acquisition economics.
Why Is My ROAS Different Between Advertising Platforms?
Different platforms can use different attribution models, conversion windows, tracking methods, conversion definitions, and reporting rules.
A customer may also interact with several platforms before converting.
Compare ROAS only after understanding how each system assigns value to advertising.
How Can I Improve ROAS?
Start by verifying your measurement.
Then determine whether performance is being limited by traffic cost, audience quality, conversion rate, conversion value, or budget allocation.
Improve the constraint that is reducing value instead of optimizing one surface metric such as CPC or CTR in isolation.

0 Comments